The Consumer Price Index (CPI) rose 3.3% year over year in July, following a 2.8% increase in June. Acceleration in headline consumer inflation was mainly attributable to a base-year effect in gasoline prices, as a large monthly decline in July 2022 (-9.2%) is no longer impacting the 12-month movement. Excluding gasoline, the CPI rose 4.1%, edging up from 4.0% in June.
Electricity prices rose significantly in Alberta, increasing by 127.8% in July on a year-over-year basis. Excluding energy, the CPI decelerated to 4.2% after a 4.4% increase in June.
The mortgage interest cost index (+30.6%) posted another record year-over-year gain and remained the largest contributor to headline inflation. The all-items excluding mortgage interest cost index rose 2.4% in July.
On a monthly basis, the CPI rose 0.6% in July, following a 0.1% gain in June, largely a result of higher monthly prices for travel tours, with July being a peak travel month. On a seasonally adjusted monthly basis, the CPI rose 0.5%.
Chart 1
12-month change in the Consumer Price Index (CPI) and CPI excluding energy
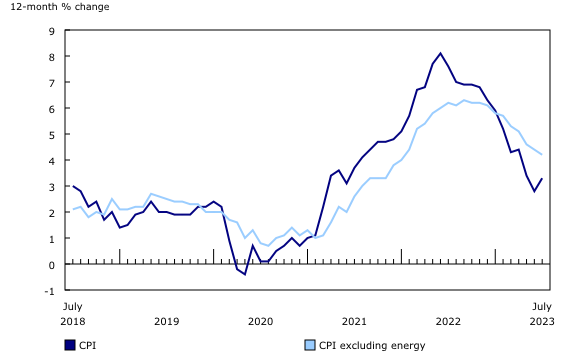
Chart 2
Accelerating price growth in five of seven special aggregates
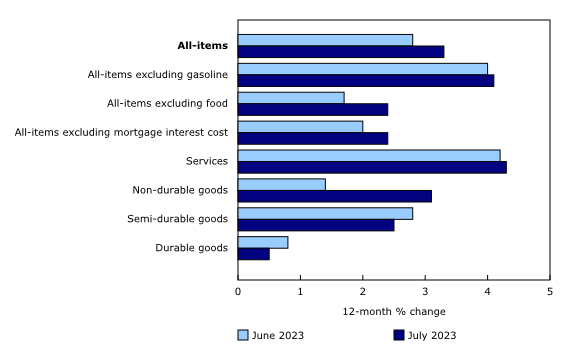
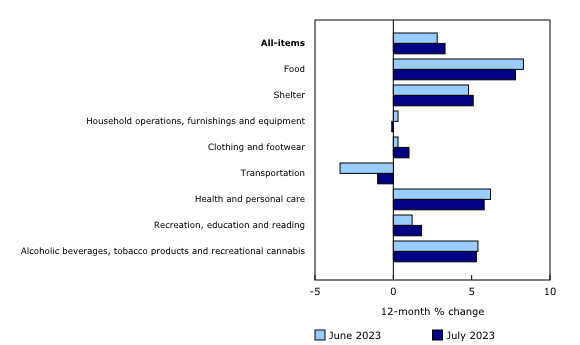
Chart 3
Gasoline prices lead smaller decline in the transportation component
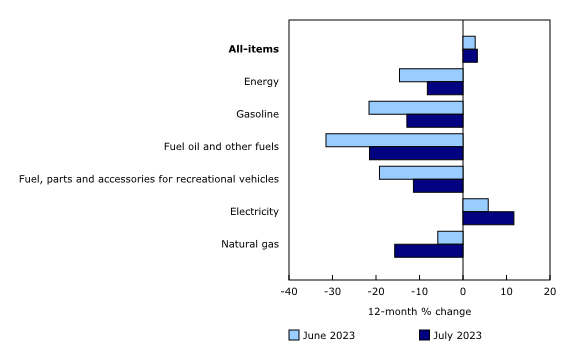
Energy products have a smaller decline in July
On a year-over-year basis, energy prices fell less in July (-8.2%) compared with June (-14.6%).
Prices for gasoline fell 12.9% year over year in July after a 21.6% decline in June. This was the result of a base-year effect, with prices remaining nearly unchanged on a month-over-month basis in July 2023 (+0.9%) compared with a 9.2% monthly decline in July 2022, when there were concerns of a slowing global economy.
Electricity prices rose at a faster pace year over year in July 2023 (+11.7%) than in June (+5.8%). This acceleration was mostly due to a 127.8% increase in Albertan electricity prices, which can be volatile, amid high summer demand. In the early months of the year, when demand was last this high, provincial rebates and a price cap kept prices lower for consumers. These policy interventions were gradually phased out and ended in spring 2023. A base-year effect also contributed to the increase. When the provincial rebate program was introduced in July 2022, prices fell 24.4% month over month. This decrease is no longer impacting the 12-month movement, putting upward pressure on the year-over-year figure.
Conversely, on a year-over-year basis, natural gas prices fell 15.7% in July 2023, compared with a 5.8% decline in June. This was mainly due to a base-year effect in Ontario, where natural gas prices rose 22.6% month over month in July 2022, following rate increases amid sustained global demand for natural gas.
Chart 4
Smaller price declines for most energy products
Prices for travel-related services slow or decline compared with July 2022
Prices for travel-related services slowed or declined compared with July 2022. Last summer, most public health measures put in place to combat COVID-19 had been removed, and demand for travel-related services increased compared with the pandemic period.
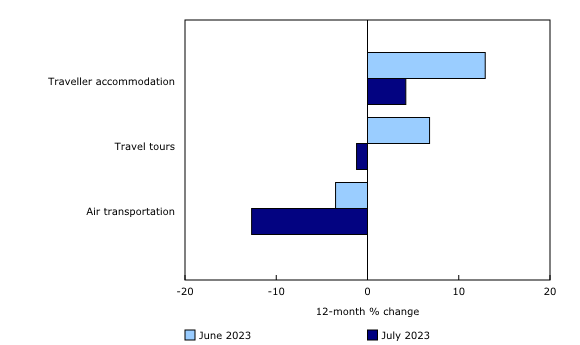
Traveller accommodation prices increased 4.2% in July on a year-over-year basis, compared with a 12.9% gain in June. Prices for travel tours declined by 1.2% in July, after increasing by 6.8% in June. In addition, airfares were down by 12.7% compared with last July, after falling by 3.5% in June.
Chart 5
Year-over-year movements in travel-related services
Lower year-over-year growth in grocery prices
While prices for groceries remained elevated, they grew at a slower pace year over year, rising 8.5% in July after a 9.1% increase in June. Slower price growth was due mainly to prices for fresh fruit and, to a lesser extent, bakery products.
Prices for fresh fruit rose 4.1% in July, following a 10.4% increase in June. The deceleration was driven by the largest month-over-month decline (-6.5%) since February 2008. This decline was largely a result of lower monthly prices for grapes (-40.9%) and oranges (-1.8%).
Bakery products cost 9.8% more year over year in July, following a 12.9% increase in June.
Explore the Consumer Price Index tools
Check out the Personal Inflation Calculator. This interactive calculator allows you to enter dollar amounts in the common expense categories to produce a personalized inflation rate, which you can compare to the official measure of inflation for the average Canadian household—the Consumer Price Index (CPI).
Visit the Consumer Price Index portal to find all CPI data, publications, interactive tools and announcements highlighting new products and upcoming changes to the CPI in one convenient location.
Browse the Consumer Price Index Data Visualization Tool to access current (Latest Snapshot of the CPI) and historical (Price trends: 1914 to today) CPI data in a customizable visual format.
Regional highlights
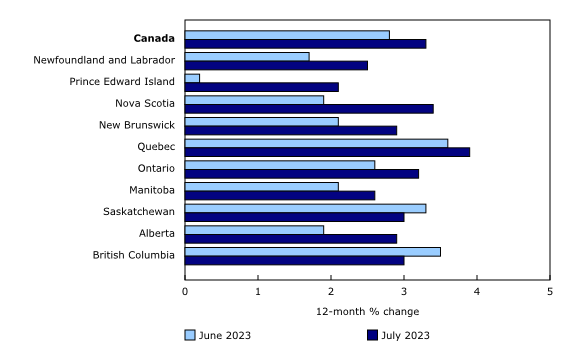
Year over year, prices rose at a faster pace in July compared with June in eight provinces. Price growth accelerated the most in Prince Edward Island, largely due to acceleration in prices for energy products.
Chart 6
The Consumer Price Index rises at a faster pace in eight provinces
Consumers in Nova Scotia see gas prices rise at the fastest monthly pace in Canada
Nova Scotians saw prices at the pump increase by 14.0% in July compared with June. The introduction of the federal carbon levy in the province and higher wholesale prices contributed to higher gasoline prices.


