The number of hate crimes reported by police in Canada rose from 2,646 incidents in 2020 to 3,360 in 2021, a 27% increase. This finding follows a 36% increase in 2020. The number of police-reported hate crimes rose by 72% from 2019 to 2021. The COVID-19 pandemic exacerbated experiences of discrimination in Canada—including hate crimes—and underscored an increase in discourse around issues of systemic discrimination.
Higher numbers of hate crimes targeting a given religion (+67%; 884 incidents), sexual orientation (+64%; 423 incidents), and race or ethnicity (+6%; 1,723 incidents) accounted for most of the reported increase from 2020 to 2021. All provinces and territories reported increases in the number of hate crimes in 2021, except for Yukon, where it was unchanged. When population size is accounted for, the rate of police-reported hate crime in Canada rose 26% in 2021, to 8.8 incidents per 100,000 population. As in previous years, more than half (56%) of police-reported hate crimes were non-violent offences, primarily mischief.
Chart 1
Police-reported hate crimes, by type of motivation, Canada, 2012 to 2021

Police-reported data on hate crimes reflect only incidents that come to the attention of police and that are subsequently classified as hate crimes.
As a complement to police-reported data, self-reported data provide further insight into experiences of discrimination and hate-motivated crime. According to the 2020 General Social Survey on Social Identity, Canadians who self-identified as belonging to a racialized group were more than twice as likely to report having experienced discrimination since the start of the COVID-19 pandemic compared with their non-racialized counterparts.
For a technical summary of context for the collection and reporting of data on police-reported hate crimes, and for recent trends in the analysis of hate and discrimination in Canada, see the article “Police-reported hate crime in Canada, 2020.” Police-reported hate crime data for 2022 will be released alongside other police-reported crime data in summer 2023.
Chart 2
Police-reported hate crimes, by province, 2018 to 2021

Hate crimes targeting a race or ethnicity increase for a third straight year
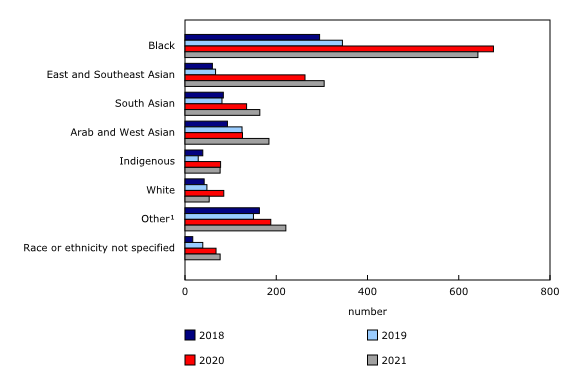
From 2020 to 2021, much of the rise in hate crimes targeting a race or ethnicity (+6%) was the result of more reported hate crimes targeting the Arab and West Asian populations (+46%; +58 incidents), the East and Southeast Asian populations (+16%; +42 incidents), and the South Asian population (+21%; +29 incidents).
Chart 3
Number of police-reported hate crimes motivated by race or ethnicity, Canada, 2018 to 2021

Hate crimes targeting the Black population dropped by 5% in 2021, following a 96% increase in 2020. There were 642 incidents targeting the Black population in 2021, corresponding to the highest rate among specific racialized groups (41 incidents per 100,000 population). The next highest rates were among hate crimes against the Arab and West Asian populations (17 incidents per 100,000 population), the East and Southeast Asian populations (9 incidents), and the South Asian population (6 incidents). See the Note to readers for limitations on interpreting hate crime rates for specific populations.
Following a large increase (+169%; +49 incidents) from 2019 to 2020, the number of police-reported hate crimes targeting Indigenous people—First Nations people, Métis or Inuit—dropped by 1 incident in 2021, totalling 77 incidents. The number of hate crimes targeting Indigenous people rose significantly during the pandemic compared with previous years (2017 to 2019).
Hate crime incidents targeting the Indigenous population continue to account for a relatively small proportion (2%) of police-reported hate crimes (4 incidents per 100,000 population in 2021). Self-reported data indicate that rates of violent victimization among Indigenous people were more than double that among non-Indigenous people. Furthermore, among people who were discriminated against, the proportion who said it occurred when dealing with the police was five times higher among Indigenous people than among non-Indigenous, non-racialized people.
There are many factors that can impact the likelihood that a given crime is reported to the police and subsequently reflected in police-reported statistics. General awareness among the community and the expertise of local police, and the relationship between a given community and the police, can play a role in how or if a crime is reported. Due to the historical and intergenerational trauma resulting from colonialism and related policies, as well as individual and systemic racism, many Indigenous people face deeply rooted social and economic challenges, including higher rates of criminal victimization, discrimination, representation in the criminal justice system, and lower levels of confidence in the police and other institutions. These and other factors can impact whether a hate crime comes to the attention of the police.
Following three consecutive years of decline, hate crimes targeting a religion peak
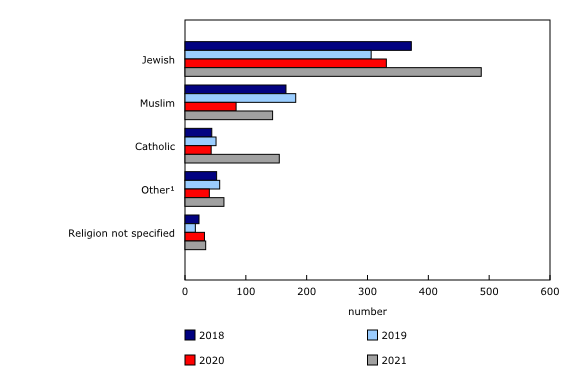
The number of police-reported hate crimes targeting a given religion rose from 530 in 2020 to 884 in 2021, representing a 67% increase. This finding marked the highest number of hate crimes targeting a religion since comparable data have been recorded and followed three consecutive years of decreases. Police-reported hate crimes targeting the Jewish (+47%), Muslim (+71%) and Catholic (+260%) religions were up in 2021 compared with the previous year.
When religious affiliation among Canadians was controlled for through the census, the rate of police-reported hate crimes targeting the Jewish population (145 incidents per 100,000 population) was highest, followed by the Muslim population (8 incidents per 100,000 population) and the Catholic population (1 incident per 100,000 population). See the Note to readers for limitations on interpreting hate crime rates for specific populations.
Chart 4
Number of police-reported hate crimes motivated by religion, Canada, 2018 to 2021

Increase in hate crimes targeting a sexual orientation
The 423 hate crimes targeting a sexual orientation recorded in 2021 rose above the previous peak of 265 in 2019. Nearly 8 in 10 (77%) of these crimes specifically targeted the gay and lesbian population, while the remainder targeted the bisexual population (2%) and people of another sexual orientation that is not heterosexual, such as asexual and pansexual people (11%). An additional 10% were incidents where the targeted sexual orientation was reported as unknown.
Both non-violent and violent hate crimes are up
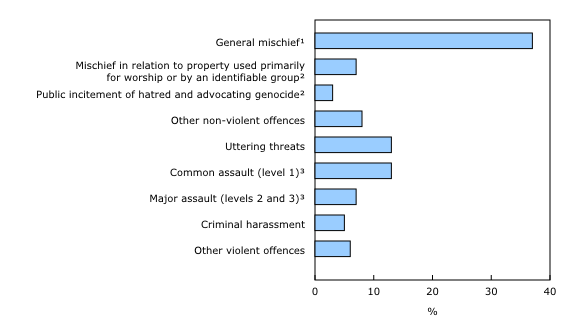
The number of non-violent (+26%) and violent (+29%) police-reported hate crimes increased in 2021. Similar to previous years, more than half (56%) of all hate crime incidents were non-violent, while the remaining 44% were violent. Also aligning with previous years, the increase in non-violent hate crime in 2021 was largely the result of more incidents of general mischief (+26%; +260 incidents).
The rise in violent hate crime was the result of more incidents of several violations, including uttering threats (+30%; +98 incidents), common (level 1) assault (+23%; +81 incidents), criminal harassment (+51%; +61 incidents), and major (levels 2 and 3) assault (+35%; +58 incidents).
Like in previous years, police-reported mischief (general mischief and mischief towards property used primarily for worship or by an identifiable group) was the most common hate crime-related offence, accounting for 45% of all police-reported hate crime incidents.
Chart 5
Police-reported violent and non-violent hate crimes, by type of offence, Canada, 2021

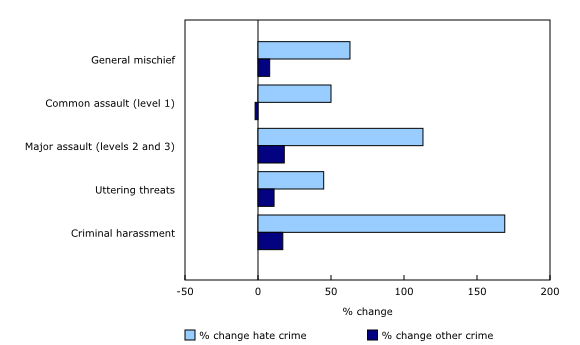
Compared with 2019 (before the pandemic), hate crimes increased to a greater extent than non-hate-motivated crimes for a subset of offences (+65% versus +7%) in 2021, including general mischief (+63% hate crime incidents versus +8% non-hate crime incidents), common assault (+50% versus -2%), major assault (+113% versus +18%), uttering threats (+45% versus +11%) and criminal harassment (+169% versus +17%); these offences accounted for the majority of hate crimes.
Chart 6
Percentage change in police-reported crime by type of crime, Canada, from 2019 to 2021

Victims of hate crime are most often men and boys, except for those targeting sex or gender
Among victims of police-reported violent hate crimes from 2018 to 2021, 62% were men and boys and 38% were women and girls. More specifically, victims of hate crimes targeting sexual orientation (72%), race or ethnicity (63%), and religion (55%) were more likely to be men and boys. In contrast, nearly three-quarters (74%) of victims of hate crimes targeting sex or gender were women and girls.
Victims of violent hate crimes targeting religion (median age of 36 years) and race or ethnicity (33 years) tended to be older compared with victims of violent hate crimes targeting sexual orientation (27 years) and sex or gender (28 years).
Victims of violent hate crimes typically sustained no injuries (76%) or minor physical injuries (21%). That said, 3% of victims sustained major injuries or were killed. Men and boys were more likely to sustain an injury regardless of the motivation for the hate crime compared with women and girls.
The relationships between the victim and the accused were similar between genders. Unlike crime in general, a large proportion of violent hate crimes were committed by strangers. Victims of hate crimes targeting sexual orientation (52%) and sex or gender (40%) were more likely to know the accused compared with victims of hate crimes targeting religion (34%) and race or ethnicity (33%).
People accused of hate crime are most often men and boys
Like crime in general, people accused of hate crime tended to be young men and boys. From 2018 to 2021, 86% of the accused were men and boys. Over the same period, the median age for people accused of hate crime was 33 years. More specifically, 17% of the accused were aged 12 to 17 years.
Nearly half of those accused of a hate crime had prior contact with the police
Based on linked incident and accused records from the Uniform Crime Reporting Survey, 2,872 people accused of at least one hate crime from 2012 to 2018 were identified. Among these people, 49% had been accused in at least one police-reported incident (not necessarily hate crime-related) in the three years preceding their first hate crime. For those with prior police contact, 32% were accused in one prior incident, 40% were accused in two to five prior incidents, and 28% were accused in six or more prior incidents. Among all prior incidents, 28% were for violations against a person (violent).
Similarly, 54% of the people accused of a hate crime in the linkage came into contact with police again within the three years following their initial hate crime violation. Among these people, 27% were accused in one subsequent incident (not necessarily hate crime-related), 40% were accused in two to five subsequent incidents, and 33% were accused in six or more subsequent incidents. Among all subsequent incidents, 30% were violent violations.
Just over one in five hate crimes results in the laying or recommendation of charges
From 2018 to 2021, just over one in five police-reported hate crimes (22%) were cleared (meaning solved) by the laying or recommendation of charges. Meanwhile, close to 7 in 10 hate crimes (69%) were not cleared, meaning police had not identified an accused person. The remaining 9% were cleared in a way other than by charges, such as departmental discretion (e.g., a warning, caution or referral to a community program) or the victim requesting that no further action be taken against the accused.
These proportions were different when comparing violent and non-violent violations. Violent hate crimes (38%) were more likely to result in the laying or recommendation of charges compared with non-violent hate crimes (9%). Given the nature of non-violent hate crimes, specifically mischief (where there may be no victim readily present and it can be done away from people or at night), a lower clearance rate would be expected as it could be more difficult to identify an accused. By comparison, for non-hate-motivated, non-violent crime (excluding traffic offences), 21% of incidents were cleared by charge, while 6% of incidents of mischief were cleared by charge.


