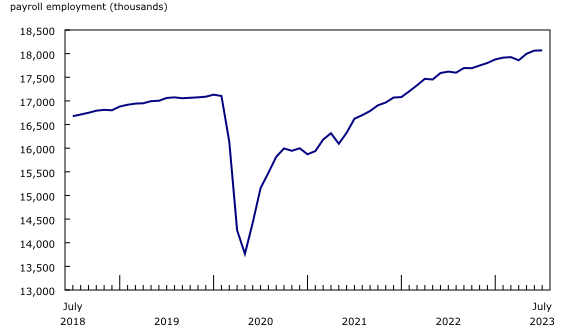
The number of employees receiving pay and benefits from their employer—measured as “payroll employment” in the Survey of Employment, Payrolls and Hours—was little changed (+4,900) in July, following an increase of 65,900 (+0.4%) in June. Meanwhile, job vacancies declined by 43,100 (-5.8%) to 701,300 in July, continuing a steady downward trend since June 2022.
Chart 1
Payroll employment was little changed in July

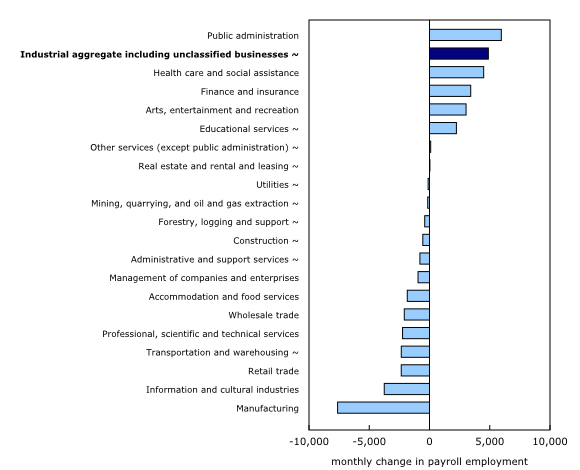
Payroll employment changes were modest in all sectors in July 2023. Public administration (+6,000; +0.5%) and health care and social assistance (+4,500; +0.2%) recorded the largest increases, followed by finance and insurance (+3,400; +0.4%) and arts, entertainment and recreation (+3,000; +1.0%).
These gains were offset by monthly declines in manufacturing (-7,600; -0.5%), information and cultural industries (-3,800; -1.0%), retail trade (-2,300; -0.1%), professional, scientific and technical services (-2,200; -0.2%), wholesale trade (-2,100; -0.3%), accommodation and food services (-1,800; -0.1%), and management of companies and enterprises (-1,000; -0.8%). The remaining nine sectors recorded little change.
Chart 2
Declines in payroll employment, led by manufacturing, offset increases led by public administration in July

Payroll employment increases in public administration
Payroll employment in public administration was up by 6,000 (+0.5%) in July. Local, municipal and regional public administration (+5,300; +1.1%) made up the majority of the monthly increase in the sector. Monthly gains in local, municipal and regional public administration were concentrated in municipal protective services (+3,900; +5.7%), which contains municipal police services, municipal fire-fighting services, and other segments of local government generally engaged in ensuring the security of persons and property.
Payroll employment in health care and social assistance continues to trend upwards
Payroll employment in health care and social assistance increased by 4,500 (+0.2%) in July. Payroll employment in this sector has generally trended up since September 2022, with cumulative gains since then totalling 87,900 (+4.0%). Payroll employment gains in July 2023 were spread across social assistance (+2,400; +0.6%), hospitals (+2,400; +0.3%), and nursing and residential care facilities (+1,800; +0.4%). However, a decline in ambulatory health care services (-2,100; -0.3%) dampened the overall monthly increase.
While national payroll employment in health care and social assistance has trended upwards since September 2022, the magnitude of this trend has differed across the provinces. Alberta (+19,500; +8.4%), Manitoba (+8,300; +8.4%), and British Columbia (+17,800; +5.6%) recorded the largest proportional increases in payroll employment since September 2022, while other provinces, such as Ontario (+22,800; +2.9%) and Quebec (+9,400; +1.8%), posted slower growth rates over the same period.
First drop in payroll employment in manufacturing in four months
Payroll employment in manufacturing dropped in July 2023 (-7,600; -0.5%), marking the first decline since March and dampening the cumulative increase recorded since January 2023 (+3,300; +0.2%). Of the 21 subsectors in manufacturing, 11 recorded declines in July, led by chemical manufacturing (-1,400; -1.5%), machinery manufacturing (-900; -0.6%) and wood product manufacturing (-800; -0.8%). Beverage and tobacco product manufacturing was the sole subsector to record an increase (+700; +1.2%), while all other remaining subsectors were little changed.
Payroll employment in retail trade falls in July
In July, payroll employment in retail trade dropped by 2,300 (-0.1%), partially offsetting gains in June (+4,000; +0.2%). Despite monthly fluctuations, the sector has recorded a net gain of 22,700 (+1.1%) since January 2023.
Nationally, the payroll employment decline in the sector was concentrated in food and beverage retailers (-1,400; -0.3%), furniture, home furnishings, electronics and appliance retailers (-900; -0.9%) and health and personal care retailers (-400; -0.2%).
Average weekly earnings increase in July
On a month-over-month basis, average weekly earnings were up 0.8% (to $1,215) in July, following monthly growth of 0.4% in both May and June. The largest gains in July were recorded in public administration (+1.9% to $1,553) and construction (+1.6% to $1,509).
Year-over-year growth in average weekly earnings was 4.3% in July, following an increase of 3.7% in June. In general, growth in average weekly earnings can reflect a range of factors, including changes in wages, composition of employment and hours worked.
In July, average weekly hours were down 0.3% (to 33.3 hours) year over year and were unchanged compared with the previous month.
Job vacancies continue to decline in July
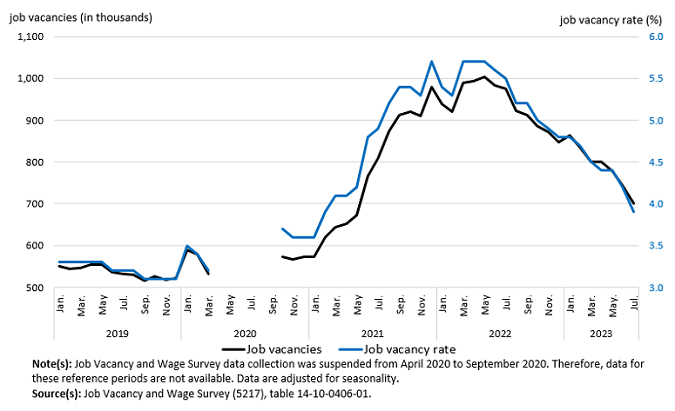
Job vacancies declined by 43,100 (-5.8%) to 701,300 in July, continuing a steady downward trend since June 2022. In July 2023, job vacancies were down by 273,700 (-28.1%) on a year-over-year basis. Job vacancies in the month were at their lowest level since May 2021 (673,400).
The number of unfilled positions decreased in five sectors in July: retail trade (-10,800; -12.8%), accommodation and food services (-10,400; -11.6%), educational services (-4,500; -18.6%), management of companies and enterprises (-1,600; -42.3%), and in mining, quarrying, and oil and gas extraction (-1,600; -16.9%). The number of vacant positions was little changed in the remaining 15 sectors.
The job vacancy rate—which corresponds to the number of vacant positions as a proportion of total labour demand (the sum of filled and unfilled positions)—decreased by 0.3 percentage points to 3.9% in July, a rate not seen since February 2021. On a year-over-year basis, the job vacancy rate was down by 1.6 percentage points, resulting from declines in vacancies (-273,700; -28.1%) combined with gains in payroll employment (+446,600; +2.7%).
Infographic 1
Job vacancies and job vacancy rate remain on a downward trend in July

In July, there were 1.7 unemployed persons for every job vacancy, up from 1.5 in June and from 1.2 at the start of the year. The increase in the unemployment-to-job vacancy ratio in July was largely attributed to the decrease in vacancies (-43,100; -5.8%), as the number of unemployed persons (as estimated in the Labour Force Survey) was little changed in July. The successive increases in the unemployment-to-job vacancy ratio since January indicate that labour market conditions continued to ease in July, even though the ratio remained below pre-COVID-19 pandemic levels, which were typically above 2.0.
Infographic 2
Unemployment-to-job vacancy ratio remains on an upward trend as job vacancies continue to decline in July

Retail trade records the lowest number of vacancies since January 2021
The number of unfilled positions in retail trade was down by 10,800 (-12.8%) to 73,100 in July 2023, the lowest since January 2021 (68,000), and marking the third monthly decline since March 2023. The job vacancy rate in retail trade was 3.5% in July 2023, down from 4.0% in June and from 4.3% in March. The drop in the job vacancy rate since March was entirely driven by the fall in job vacancies (-17,900; -19.7%), as payroll employment decreased 0.7% (-14,000) over this period.
Job vacancy rate in accommodation and food services reaches lowest level since January 2020
In accommodation and food services, the number of vacant positions decreased by 10,400 (-11.6%) to 79,500 in July, following decreases of 9,300 (-8.2%) in May and 13,200 (-12.8%) in June. The job vacancy rate in the sector was 5.7% in July, down by 0.7 percentage points from June. It was also down by 2.2 percentage points from April, and at the lowest rate since January 2020. The fall in the job vacancy rate from April to July 2023 reflects solely the net decrease in vacancies (-32,900; -29.3%) as payroll employment was little changed over the period.
Job vacancies show little change in health care and social assistance
In July, the number of unfilled positions in health care and social assistance (139,200) was little changed from the previous month, and accounted for nearly 1 in 5 (19.9%) job vacancies across all sectors.
Job vacancies fall in four provinces
In Ontario, the number of vacancies fell by 27,700 (-10.2%) to 242,600 in July, following little variation in May and June. Saskatchewan (-4,100 to 22,200), New Brunswick (-2,500 to 11,500) and Prince Edward Island (-1,000 to 2,900) recorded declines in job vacancies in July as well. There was little change in the number of vacancies in the other provinces.
On a year-over-year basis, job vacancies decreased in seven provinces in July, while they showed little variation in Newfoundland and Labrador, Prince Edward Island and Saskatchewan. Ontario (-123,900; -33.8%) recorded the largest drop year over year in July, followed by Quebec (-65,800; -26.6%) and British Columbia (-38,400; -26.0%).


