


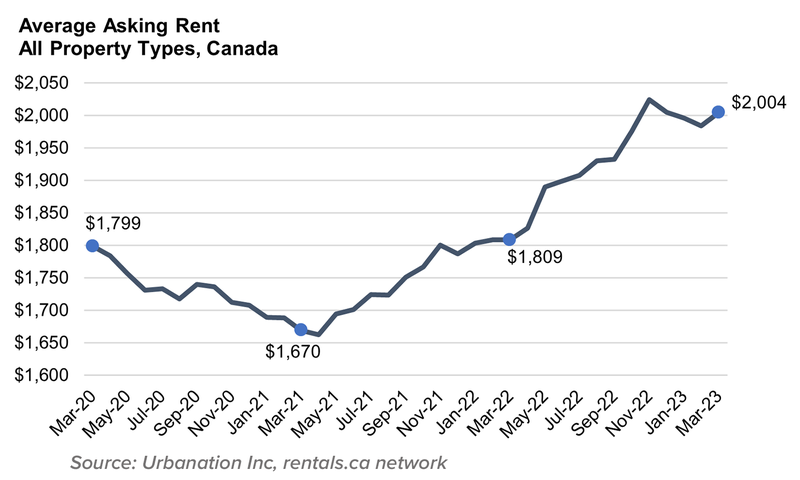
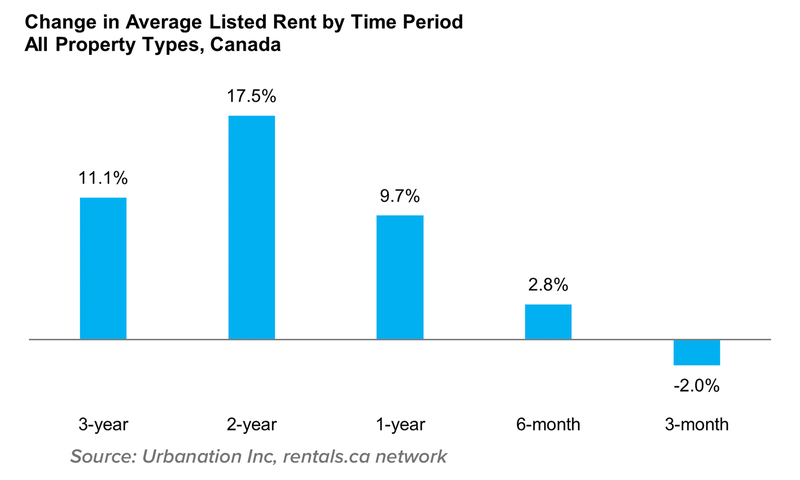
Rents have Moderated Over the Past 3 Months
Asking rents in Canada increased 9.7% annually to an average of $1,984 in February. The annual rate of rent inflation has been moderating since reaching a high of 12.4% in November 2022. Rents decreased 0.6% from January 2023, the third consecutive monthly decline, and decreased by a cumulative 2.0% over the past three months, indicating some softening in the market related to reduced affordability in the rental market, a recent improvement in home-buying demand, and an increase in new supply from apartment completions.
National Overview
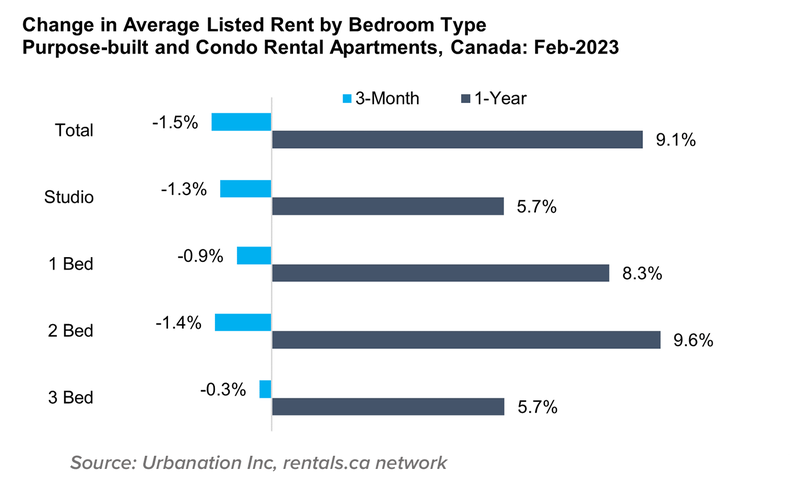
The average asking rent for purpose-built and condominium apartments reached $1,908 in February, up 9.1% annually while posting a three-month decrease of 1.5%. Two-bedroom asking rents averaged $2,103, rising the fastest on an annual basis by 9.6% but recording the largest three-month decline of 1.4%. One-bedroom rents increased 8.3% year over year to $1,724, dipping 0.9% over the past three months. Rents for studios and three-bedrooms both increased 5.7% from a year ago to an average of $1,385 and $2,382, respectively. Three-bedroom rents recorded the smallest three-month decline of 0.3%.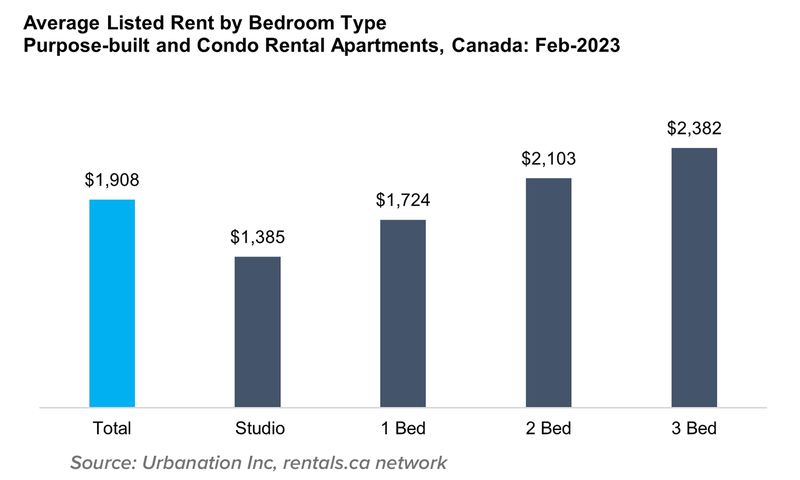
Provincial Overview
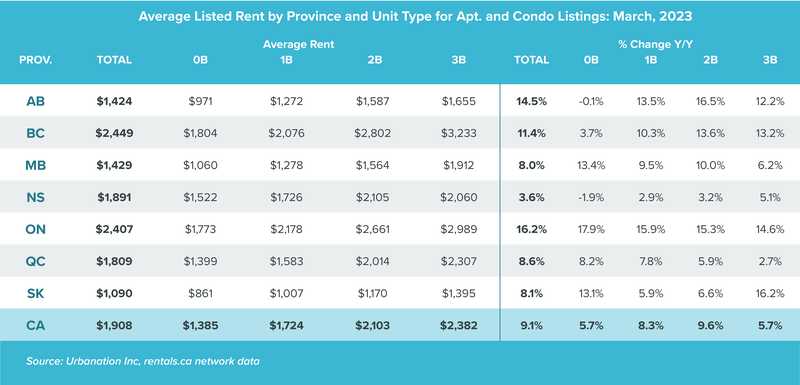
*Totals are reflective of all available listings and not the data listed within individual tables
Quebec had the Fastest Rent Growth Over the Past 3 Months
Ontario led the country in annual rent inflation during February with 16.2% growth for purpose-built and condominium apartments, followed by Alberta and British Columbia where rents rose 14.5% and 11.4% year over year, respectively. Over the past three months, rents increased the most in Quebec (+2.9%) and Ontario (+1.0%), while all other provinces recorded three-month rent declines for purpose-built and condominium apartments.
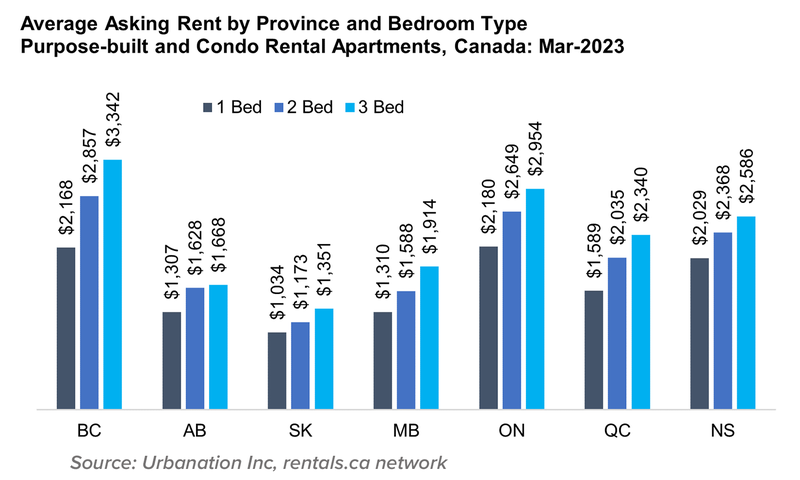
Rents for purpose-built and condominium apartments remained highest in British Columbia during February at an average of $2,449, including $2,076 for one-bedrooms, $2,802 for two-bedrooms, and $3,233 for three-bedroom apartments. Ontario rents followed close behind at an average of $2,407, while the third highest rents were considerably less expensive in Quebec at an average of $1,808. Although Alberta rents have been increasing over the past year, they remain comparatively low at an average of $1,424, with one-bedrooms averaging $1,272, two-bedrooms averaging $1,587, and three-bedrooms averaging $1,655. Alberta has been recording the highest levels of interprovincial migration in Canada.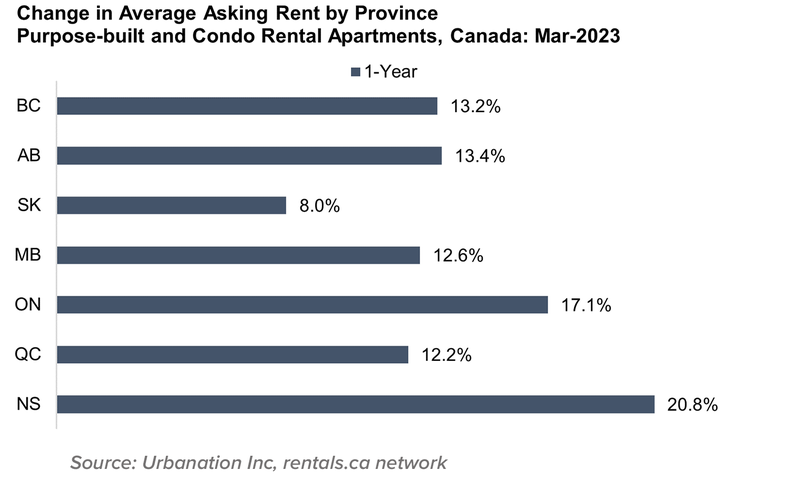
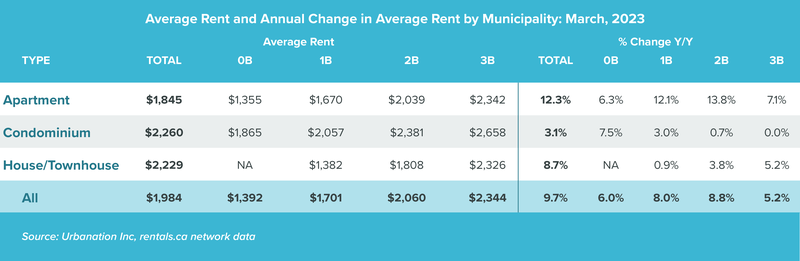
Municipal Rental Rates
*Totals are reflective of all available listings and not the data listed within individual tables
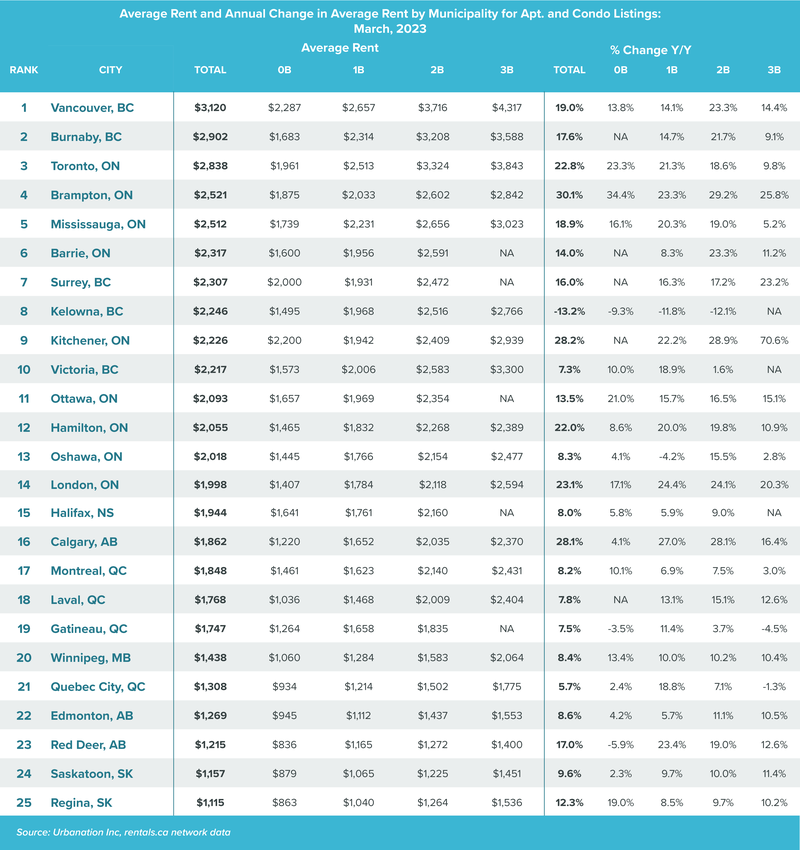
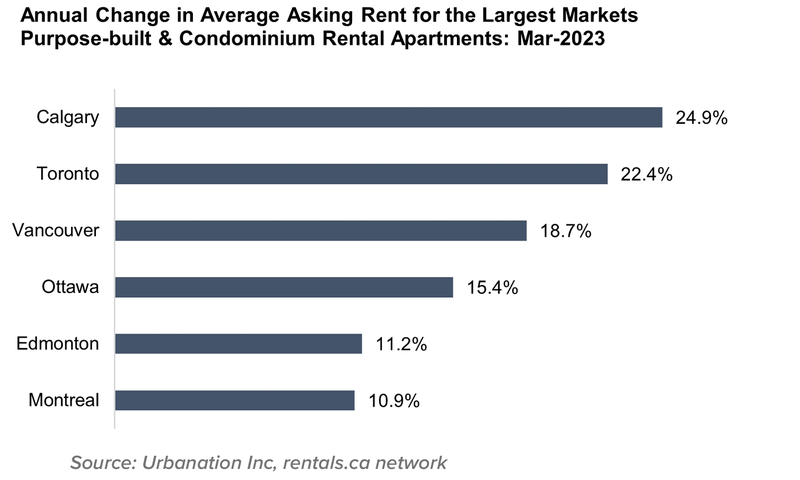
Calgary Leading Rent Growth Among Canada’s Largest Markets
Among Canada’s largest markets, asking rents increased the fastest in Calgary over the past three months (+3.8%) and 12 months (+28.1%), reaching an average of $1,862 in February. Calgary rents remained below the national average, with one-bedrooms averaging $1,652, two-bedrooms averaging $2,035, and three-bedrooms averaging $2,370. Toronto experienced the second fastest annual rent growth of 22.8% despite recording a 0.9% three-month decline, reaching an average of $2,838. One-bedroom rents in Toronto were well above the national average, with one-bedrooms averaging $2,513, two-bedrooms averaging $3,324, and three-bedrooms averaging $3,843. Vancouver, which continues to be the most expensive of Canada’s largest markets, saw rents increase 19% annually to an average of $3,120 in February. Rents in Vancouver averaged $2,657 for one-bedrooms, $3,716 for two-bedrooms, and $4,317 for three-bedrooms.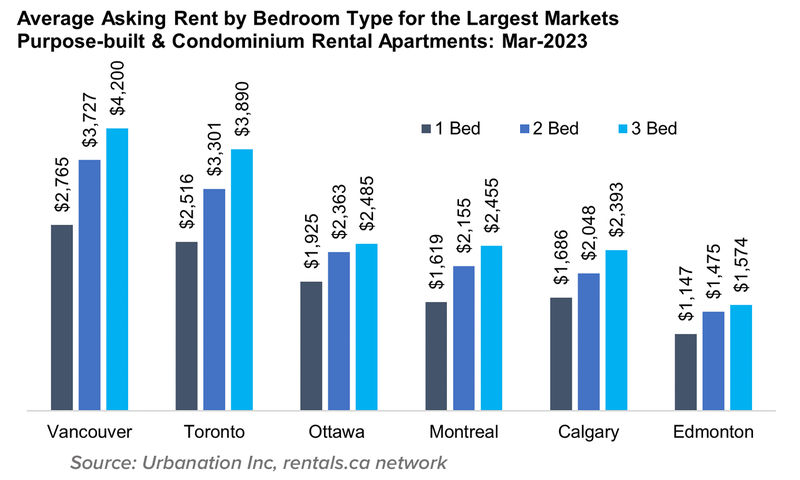
Southwest Ontario Rents Surge in February
In mid-sized cities, average rents for purpose-built and condominium apartments were highest in cities in Metro Vancouver — including Burnaby ($2,902), Coquitlam ($2,726) and Richmond ($2,545) — and cities and areas in the Greater Toronto Area (GTA) — including Oakville ($2,579), Vaughan ($2,579), and Etobicoke ($2,546). The 12 most expensive mid-sized rental markets in February were all in Metro Vancouver and the GTA.
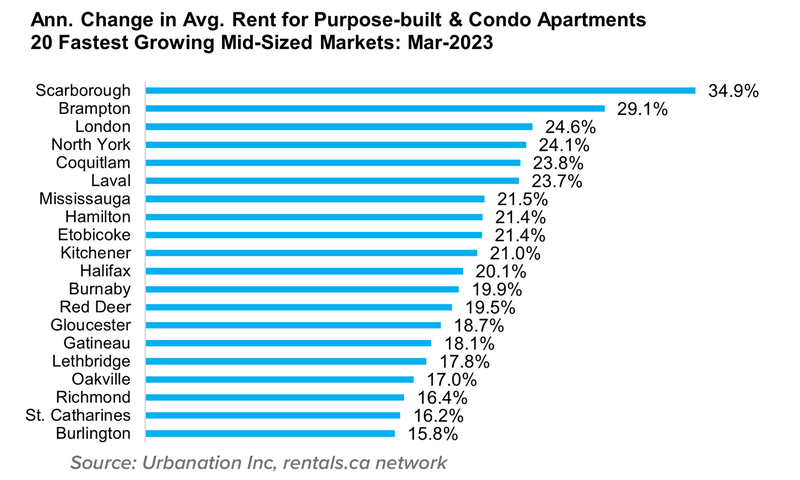
The seven fastest growing mid-sized markets for purpose-built and condominium rents in February were all in southwestern Ontario, with annual rent growth led by Brampton (+30.1%), Kitchener (+28.2%), Scarborough (+28.1%), North York (+26.5%), London (+23.1%), Hamilton (+22%) and Mississauga (+18.9%).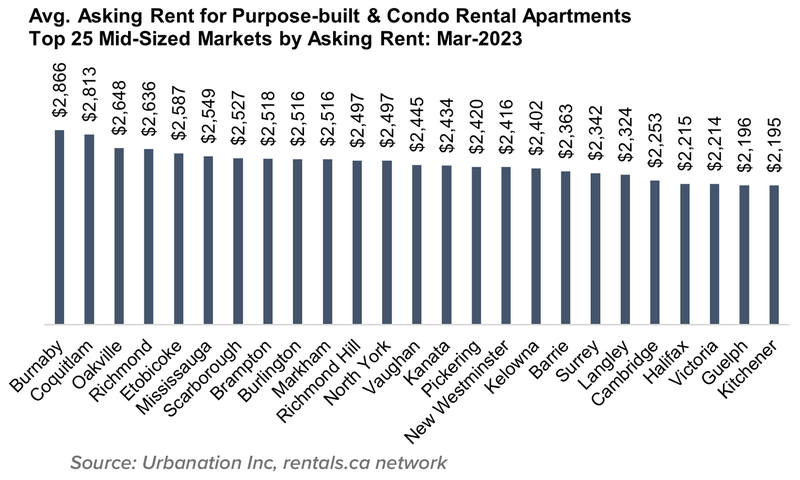
Rentals.ca Data
The data used in this analysis is based on monthly listings from the Rentals.ca Network of Internet Listings Services (ILS). This data differs from the numbers collected and published by the Canada Mortgage Housing Corporation (CMHC).
The Rentals.ca Network of ILS’s data covers both the primary and secondary rental markets and includes basement apartments, rental apartments, condominium apartments, townhouses, semi-detached houses, and single-detached houses. CMHC’s primary rental data only includes purpose-built rental apartments and rental townhouses. CMHC also collects data on secondary market rentals, but this is reported separately.
CMHC’s rental rates are based on the entire universe of purpose-built rental units (rental stock), regardless of rental tenure. CMHC rental rates are reflective of what the average household spends on rental housing and not the current market rents for vacant units. The data used in this report is based on the asking rates of available (vacant) units only and reflect on-going trends in the market. This covers a smaller sample size but is more representative of the actual market rent a prospective tenant would encounter. The Rentals.ca Network of ILS’s data typically provides much higher rental rates compared to CMHC, as vacant units typically reset to market rates when not subject to rent control.
The average and median rental rates in this report can also skew higher than CMHC’s data for the following reasons: the inclusion of larger more expensive unit types such as single-family homes, townhouse units, and large luxury condominium units; the presence of duplicate or multiple listings at the same property and the survivorship bias where more expensive or over-priced units take longer to lease and remain in the sample longer.
Properties listed for greater than $5,000 per month, and less than $500 per month are removed from the sample. Similarly, short-term rentals, single-room rentals, and furnished suites are removed from the sample when identifiable.